


Stone River eLearning – Making Graphs in Python using Matplotlib for Beginners
 Salepage : Stone River eLearning – Making Graphs in Python using Matplotlib for Beginners
Arichive : Stone River eLearning – Making Graphs in Python using Matplotlib for Beginners
Description
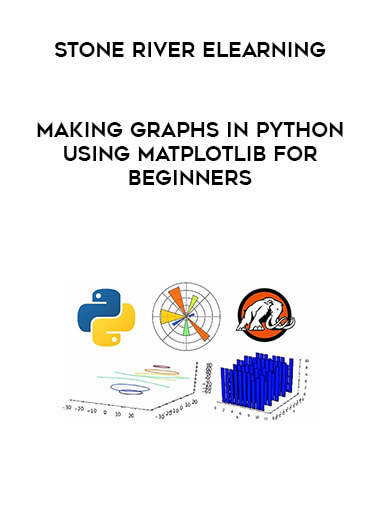
Making Graphs in Python using Matplotlib for Beginners(Max)
Learn how to start visualizing all your data directly in your code
Data and analytics are becoming increasingly important in our world and in modern day businesses. To start off – data analytics (and ultimately provide nice images of our results), we need to be able to plot our data, preferably in the way we imagine it in our heads.
Matplotlib provides many great plotting opportunities and methods for data visualization, and in this course we will be looking at some introductory methods for getting started – creating plots in Python.
Once we have a starting point for plotting data we can easily expand our knowledge to different areas to make sure we can best represent all of our data.
- Basic Python knowledge
- A Python 3 Environment to Code in
Course Curriculum
-
Start
Introduction to Matplotlib (2:51)
-
Preview
Importing Libraries in Python (8:40)
-
Start
Dealing – Files in Python (14:18)
-
Start
Making Line and Scatter Plots (14:07)
-
Start
Adding Labels, Titles, Axis Ticks, and Changing Line Styles (9:52)
-
Start
Rotating Axis Ticks, Adding Text and Annotations (7:57)
-
Start
Adjusting Plot Sizes, Adding a Legend, and Saving the Plots (8:33)
-
Preview
Creating 1-Dimensional and 2-Dimensional Histograms (13:42)
-
Start
Changing the Axis Scales (13:27)


Reviews
There are no reviews yet.